Mapping the world’s climate danger zones
With 2024 on track to be declared the hottest on record, scientists from IIASA and Columbia University have noticed that specific regions are consistently more affected by extreme temperatures. A new study provides the first worldwide map of these regional climate danger zones.
Amid the continued upward march in average temperatures over the past decades, a recent surge of record shattering extreme heat waves raise questions about the degree to which climate models can provide adequate estimates of relations between global mean temperature changes and regional climate risks. The study just published in the Proceedings of the National Academy of Sciences (PNAS) provides the first worldwide map of high-risk regions.
“This is about extreme trends that are the outcome of physical interactions we might not completely understand,” explains lead author Kai Kornhuber, Theme Lead on Weather Extremes and Climate Dynamics in the IIASA Energy, Climate, and Environment Program. “These regions become temporary hothouses.” Kornhuber is also an adjunct assistant Professor of Climate at the Columbia Climate School.
The study looks at heat waves over the past 65 years, identifying areas where extreme heat is accelerating considerably faster than typical warm-season temperatures overall. This often results in maximum temperature records that have been repeatedly broken. These extreme heat waves have been hitting predominantly in the last five years, although some occurred in the early 2000s or before.
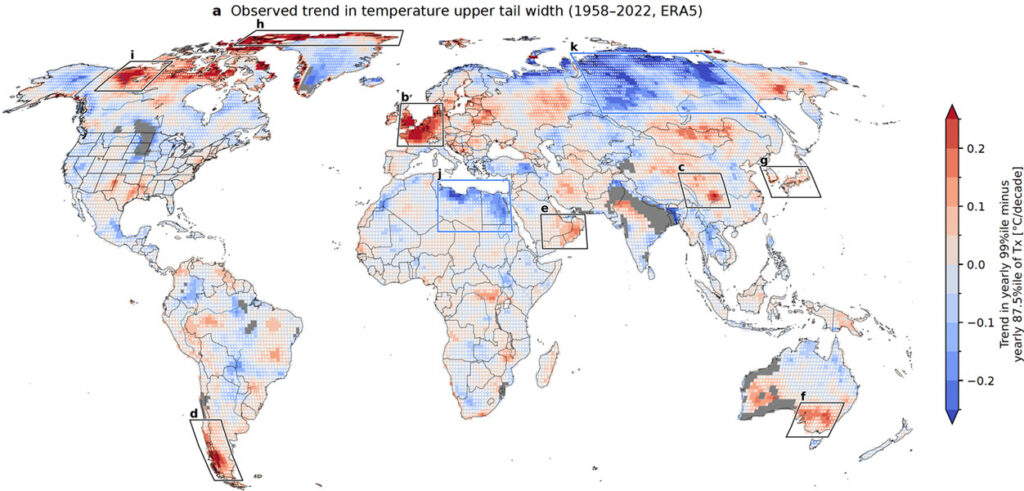
The most hard-hit regions include central China, Japan, Korea, the Arabian Peninsula, eastern Australia and parts of South America and the Arctic. The most intense and consistent signal, however, comes from northwestern Europe, where sequences of heat waves contributed to around 60,000 deaths in 2022 and 47,000 in 2023. These occurred across Germany, France, the United Kingdom, and the Netherlands among others. In September this year, new maximum temperature records were set in Austria, France, Hungary, Slovenia, Norway and Sweden. Many parts of the United States Southwest and California also saw record temperatures well into October.

In these regions, extreme temperatures are increasing faster than average summer temperatures, at a rate far higher than what state-of-the art climate models have been projecting for the past few decades. The phenomenon is however not happening everywhere; the study shows that the increase in temperatures across many other regions is lower than what models would predict. These include wide areas of the north-central United States and south-central Canada, interior parts of South America, much of Siberia, northern Africa and northern Australia.
“In most areas, the hottest days of the year are warming about as fast as typical summertime days, which is the dominant signal of climate change, and in some areas even slower. In the hotspots that we point out, however, the hottest days have been warming particularly fast, which could be for various reasons. In some places there could be more occurrences of specific heatwave-inducing weather patterns, or soil drying could be amplifying the hottest temperatures—and it will be important to untangle these specific local drivers,” says coauthor Samuel Bartusek, a PhD candidate at the Columbia University.
“Due to their unprecedented nature, these heat waves are usually linked to very severe health impacts, and can be disastrous for agriculture, vegetation, and infrastructure,” adds Kornhuber. “We’re not built for them, and we might not be able to adapt fast enough.”
This study is an important first step towards addressing the emerging risk from extreme and unprecedented heat by identifying regions that have historically faced rapidly increasing risk and quantifying the ability of models to reproduce these signals.
- Kornhuber, K., Bartusek, S., Seager, R., Schellnhuber, H.J., Ting, M. (2024). Global emergence of regional heatwave hotspots outpaces climate model simulations. Proceedings of the National Academy of Sciences (PNAS) DOI: 10.1073/pnas.2411258121
Source
International Institute for Applied Systems Analysis (IIASA) 2024


